

Dallas Middle Market Finance: Where the Growth Is Coming From
Dallas-Fort Worth added 43,900 jobs over the year to September. About two-thirds came from a single supersector, and three others went backward.
Dallas-Fort Worth employment grew 1.0 percent in the year to September 2026, according to preliminary Bureau of Labor Statistics data, a gain of 43,900 jobs. Revised August data shows the same 1.0 percent rate.
One percent is a number you can take to a board meeting and say almost nothing with. The useful information is underneath it, in which parts of the economy produced the gain and which did not.
Two-thirds of the growth came from one place
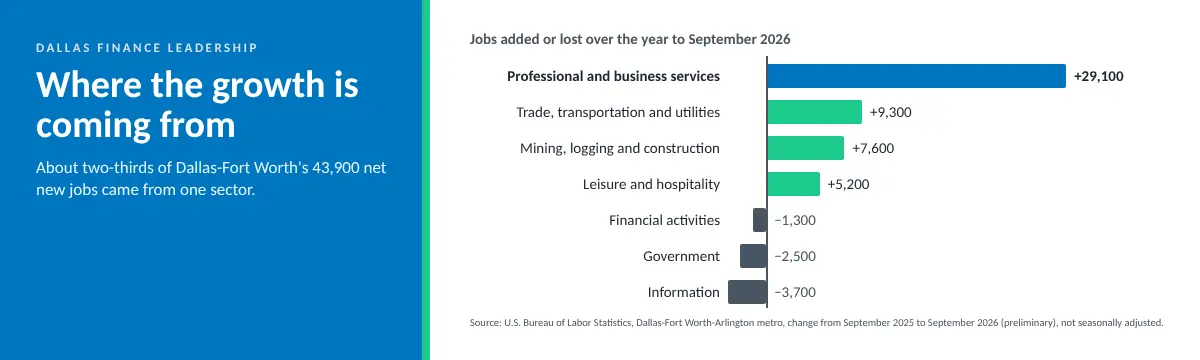
Professional and business services added 29,100 jobs over the year to September. That is about two-thirds of the metro’s net job growth, from a supersector that accounts for about 19 percent of total employment.
The other gains were smaller. Trade, transportation and utilities added 9,300 jobs, mining, logging and construction 7,600 and leisure and hospitality 5,200. Measured against total gains before netting out losses elsewhere, professional and business services still supplied more than half.
Three categories shed more than 1,000 jobs each over the same period. Information fell by 3,700, government by 2,500 and financial activities by 1,300. Manufacturing and education and health services were essentially flat, at plus 100 and minus 100.
For a finance leader here, the composition matters more than the headline because the aggregate is describing several different economies at once. If you are in financial services, information or manufacturing, the regional growth number is describing someone else’s year.
The state forecast has come down three times since July
The Dallas Fed has cut its Texas employment forecast at three consecutive releases. In July it projected 2.0 percent growth for 2026. On 21 August that became 1.7 percent, on 18 September 1.2 percent, and on 19 October 0.9 percent, with an 80 percent confidence band of 0.6 to 1.2 percent and 134,000 projected job additions.
Two qualifiers belong with that sequence. The Dallas Fed attributed the September step mainly to first quarter benchmark revisions, which lowered the state’s year-to-date employment growth to a pace more consistent with labor supply constraints. And the October release reports that the Texas Leading Index increased over the three months ending in September, helped by the help-wanted index, the US leading index, lower new unemployment claims and a lower Texas value of the dollar, while shorter average weekly hours, a lower Texas stock index and a lower real oil price weighed against it. A forward-looking index moving up belongs in any account of a forecast being marked down.
The monthly data is noisier than the forecast path suggests. Texas employment declined at an annualized 1.6 percent in September, but August was revised upward to an annualized 2.3 percent increase. Year-to-date growth stands at 0.8 percent against a long-running state average of 2 percent, and the statewide unemployment rate held at 4.4 percent.
Luis Torres, senior business economist at the Dallas Fed, said the moderation in job growth is consistent with current labor supply constraints that partly result from sharply lower immigration. He noted that employment declined in most sectors while manufacturing remained a bright spot, supported by oil and gas activity, export growth and AI-related construction.
The Dallas Fed’s commentary does not break those drivers down by metro, so statewide manufacturing strength and flat Dallas-Fort Worth manufacturing employment over the year are both true without either one explaining the other. The regional average is not your sector, and the state average is not your region.
What middle market firms said in July
RSM’s Middle Market Business Index for the third quarter, based on 501 responses collected between 7 and 29 July, registered 111.8 against 113.6 the prior quarter. RSM described the change as statistically insignificant. RSM reads values above 100 as the middle market generally expanding.
Within that survey, 58 percent reported higher revenues in the quarter, 59 percent higher net earnings, 57 percent increased capital expenditure and 54 percent increased hiring, though only 43 percent said the economy itself had improved. Seventy-five percent paid higher prices in the quarter and roughly 66 percent raised their own. Looking ahead, 68 percent expected both revenues and net earnings to rise over the following six months, 65 percent expected to raise capital outlays, 60 percent planned to add employees and 58 percent expected the economy to improve, while 76 percent expected to pay higher prices and 70 percent to charge them.
RSM’s own reading is emphatic. Its chief economist, Joe Brusuelas, described the American middle market as prospering amid a solid economic expansion, and called sustained capital spending the most encouraging long-term trend observed in the survey’s decade-long history.
Three things to keep straight when reading this next to the regional numbers. It surveys middle market firms nationally, not in Dallas. The forward-looking figures were collected in July across roughly the following six months, so August and September employment data neither confirms nor contradicts them. And RSM notes the panel is in transition to its new middle market definition, with respondents from companies under $30 million in revenue being screened out, which matters when comparing one quarter with the last.
What Texas firms said about credit in October
In October the Dallas Fed asked 283 Texas business executives about the cost and availability of credit, collecting responses between 13 and 21 October from 63 manufacturing firms and 220 service firms.
Nearly half the sample, 46.3 percent, answered that the cost question did not apply to them. Of the full sample, 35.3 percent said the cost of credit available to their firm had increased over the preceding 12 months, 18.0 percent reported no change and 0.4 percent reported a decrease. The Dallas Fed’s own summary of that result is that the majority either did not access credit or saw no change in cost.
The sector split looks wider than it is. Manufacturers reported higher costs at 41.3 percent against 33.6 percent for service firms, but manufacturers were also far less likely to answer not applicable, at 38.1 percent against 48.6 percent for service firms. Setting the not-applicable responses aside, the share reporting higher costs is close to identical in the two groups.
On availability, 15 percent reported at least some difficulty obtaining short-term financing and 16 percent on long-term financing, both unchanged from a year earlier. The Dallas Fed adds that the short-term figure remains above its 2018-19 results and the long-term figure is somewhat elevated relative to 2018-19, so access is flat against last year but not against before the pandemic. No equivalent year-earlier figure is published for the cost question, so the two cannot be set side by side to conclude that price moved while access did not.
The follow-up went only to firms reporting higher costs, leaving 25 manufacturing and 71 service responses. Counting actions already taken, the most common in both groups was increasing reliance on internal funds, at roughly 56 percent. Reducing or delaying capital expenditure or expansion plans came next, at 44 percent of manufacturers and 38 percent of service firms. Below that the groups diverge. Manufacturers reduced or delayed hiring at 33 percent, carried less inventory at 25 percent and raised prices at 20 percent. Service firms raised prices at 28 percent, with hiring cuts and faster debt paydown tied at 25 percent. Counting actions taken and planned together, raising prices moves to roughly 60 percent in both groups, ahead of capital expenditure reduction and behind only increased reliance on internal funds, at about 72 percent.
The question records what firms did, not when, so this is a frequency count rather than a sequence. In both groups more firms turned to internal funds and curtailed capital spending than cut hiring. Price increases sit below hiring among manufacturers and just above it among service firms, and the Dallas Fed’s all-firm summary says just over a quarter of these firms pulled back on hiring or increased prices.
Scale matters. The firms reporting a hiring pullback number about 26 out of 283, drawn from across Texas, and these particular questions measure no employment. They are a read on what business executives say they are doing about the price of credit. They are not an explanation of the metro employment figures above, and the Dallas Fed’s forecast commentary links the statewide slowdown to labor supply constraints.
Where the capital is going
Separate RSM research, conducted by The Harris Poll between 1 and 23 April among 500 senior executives at US middle market companies with annual revenue between $30 million and $10 billion, found 59 percent planning to increase capital investment over the next three years citing the immediate expensing provisions in the One Big Beautiful Bill Act, the federal tax law enacted in July 2025. In the same study 51 percent of executives familiar with the law expected a positive impact on future growth, and 53 percent anticipated a positive effect on after-tax cash flow, which RSM reports without saying whether the same familiarity filter applies. Both are bare majorities.
Among executives planning to invest more, 70 percent expected most of that spending to go toward accelerating projects already under consideration rather than new ones. That is 70 percent of the 59 percent, so roughly two in five of the sample, and most of their spending rather than all of it.
The direction is still worth noting. A company accelerating a project it had already scoped is behaving differently from one committing to something new, even though both appear as increased capital investment in a survey.
RSM also asked where the benefits would be applied across eight areas. Every one was cited by more than three-quarters of respondents, from capital investment at 89 percent down to hiring and mergers and acquisitions at 76 percent each. The figures sum far above 100, so these appear to be separate items rather than a forced ranking, and RSM publishes no margin of error. The spread reads better as broad agreement across all eight than as a priority order.
The talent math
In the RSM index survey, 57 percent of middle market executives reported increasing compensation in the quarter and 66 percent expected to increase it over the following six months. RSM does not report the size of those increases.
Average local pay sits above the national line. Preliminary BLS data puts the average weekly wage across all industries in the Dallas-Fort Worth metro at $1,785 for the first quarter of 2026 against $1,654 nationally, about 8 percent higher. That is an all-industry average, so it reflects the metro’s mix of jobs as well as pay rates, and it is not a like-for-like comparison for any single role. Growth in total compensation costs has been slower here than nationally: the BLS Employment Cost Index shows private industry compensation costs in the wider Dallas-Fort Worth combined statistical area rose 2.7 percent in the 12 months to June 2026, against 3.3 percent nationally.
Accounting, management consulting and staffing firms all sit inside the professional and business services supersector, which is the one that produced the largest absolute share of the metro’s net job growth. So do building services, security and waste management, so the supersector is not uniformly professional, and the BLS figures cited here do not show which industries within it drove the 29,100. With that caveat, a company hiring finance or analytical staff in Dallas-Fort Worth is plausibly competing for people with the part of the economy that grew most. Neither source breaks out finance roles, and no cited data shows which industries employ controllers, so this is an inference about competing demand rather than a measured finding.
What this means for the plan on your desk
Four questions worth answering before the 2027 plan is approved:
· If your hiring plan assumes regional wage and availability conditions, which part of the economy’s conditions did you actually use? In this metro, professional and business services grew 3.7 percent over the year while manufacturing was flat and financial activities and information shrank.
· What is your own cost of credit today against twelve months ago, and has anyone put that number next to the capital plan rather than in a separate treasury update?
· Which projects in the 2027 plan are genuinely new, and which had already been scoped and are now being pulled forward? The second kind is easier to defer again, and a board will ask.
· If you are funding growth from operating cash, what working capital assumption is that resting on, and what happens if collections slow by two weeks?
None of this argues for pessimism. A metro adding 43,900 jobs over the year is a functioning market, and the national middle market survey data is on balance positive. It argues for precision about which part of that market you are operating in, because the aggregate is now averaging across sectors moving in opposite directions.
Regional conditions and planning assumptions come up regularly in our programming, often because members are working the same problem from different sectors. Join us at an upcoming session. FEIDallas.org
Disclosure: RSM US is an FEI Dallas chapter sponsor. Its published research is cited here on the same basis as any other source.

Leave a Reply